
As the cryptocurrency market continues to evolve, IOST (Internet of Services Token), once one of the top public blockchains, has seen its price trends and future potential draw significant attention from investors. This article provides price predictions and strategies for 2026–2030 from technical, ecosystem, exchange, and macroeconomic perspectives, backed by historical data and practical case studies.
I. Introduction: Why is Predicting IOST Price Harder Than Most Altcoins?
IOST’s historical performance has been volatile. In 2018, IOST ranked among the top 50 public chains, but subsequent market conditions and technological updates pushed it out of the top 200. This volatility reminds investors that predicting IOST’s price requires not just looking at candlestick charts, but also considering the ecosystem of the public chain itself and macroeconomic factors.
Notably, about 90% of IOST predictions online are filled with clickbait, often featuring:
- Numbers without logical explanations;
- Overreliance on historical highs or lows;
- Ignoring on-chain activity and macro factors.
This article analyzes IOST’s price range from four dimensions: on-chain ecosystem, exchange liquidity, team progress and roadmap completion rate, and macro & policy environment.
II. Understanding IOST: Before Predicting Price, You Must First Grasp the Real Situation of This Public Chain
2.1 Core Technology and PoB Mechanism
IOST adopts the Proof-of-Believability (PoB) consensus mechanism, which determines block production order based on node reputation scores and voting weights. This means the IOST network improves transaction efficiency while maintaining decentralization. In simple terms, “higher reputation, faster transaction processing,” making it suitable for high-frequency, micropayment, and gaming DApps.
2.2 On-Chain Activity
According to IOSTscan and CoinGecko data, current active addresses, daily transaction volume, and DApp activity on IOST show that the on-chain ecosystem still has a certain user base, but is far behind TRX or EOS. Investors should monitor the growth rate of active on-chain addresses, as it directly impacts token usage demand and price support.
2.3 HiBT Exchange Case
The listing of IOST trading pairs on HiBT indicates that small and medium-sized exchanges are still willing to provide liquidity. Exchange listings not only allow users to trade the token but also signal that “the coin still has potential trading value.”
2.4 Competitive Landscape
IOST’s direct competitors include TRX and EOS. In terms of technological iteration and ecosystem activity, IOST lags behind, but still maintains some advantages in PoB consensus and micropayment scenarios.
III. 5 Core Variables Affecting IOST Price (2026–2030)
- Bitcoin Bull/Bear Cycles: IOST price tends to follow BTC with a 1–2 month lag; historical data shows price fluctuations of 30–50% in the year after a halving.
- On-Chain Ecosystem Activity: Tools like IOSTscan allow real-time monitoring of daily transaction volume and smart contract calls.
- Exchange Liquidity: On exchanges like HiBT, small and medium venues have limited order book depth, with price differences up to 5%.
- Team Progress & Roadmap Completion Rate: The actual delivery of new DApps and ecosystem subsidies promised by the IOST team over the past three years directly affects market confidence.
- Regulatory Policies: Looser regulation in Asian markets favors price increases, while tightening may lead to reduced liquidity.
IV. IOST 2026 Price Prediction: Will the Bull Market Window Materialize?
- Macro Background: 2026 is the second year after the BTC halving; historical patterns show most coins perform well in this cycle.
- HiBT Data Reference: IOST trading volume trends from 2024–2025 indicate that retail entry pace will directly impact price gains in 2026.
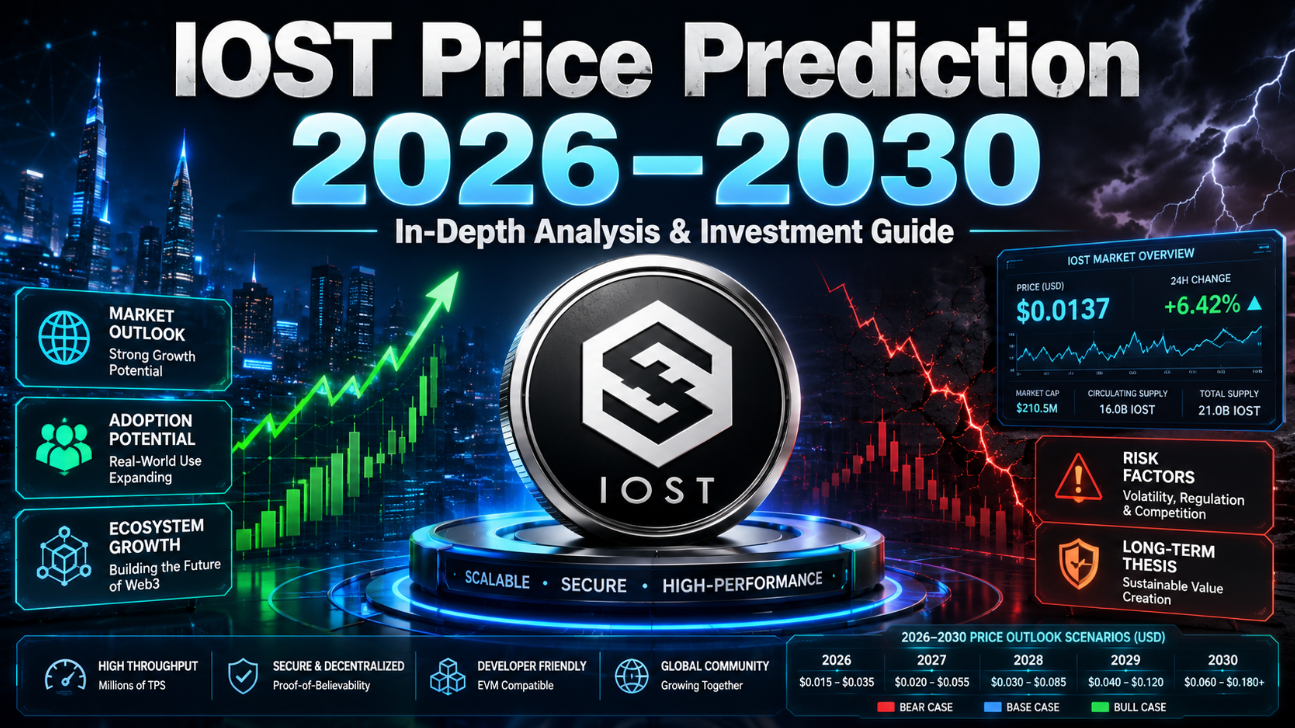
- Price Range Prediction:
- Bullish: 0.008–0.015 (ecosystem delivery + BTC > $100k)
- Neutral: 0.004–0.008 (moderate market rise)
- Bearish: 0.001–0.003 (BTC pullback + no new narratives)
- Entry Strategy: Buying IOST in 2026 at 0.004–0.008 is a relatively reasonable risk range.
V. IOST 2027 Price Prediction: End of Bull Run or Second Leg Up?
- Historical Signal: The end of a bull run is often accompanied by exchange liquidations and abnormal funding rates; monitor HiBT data.
- Scenario Prediction: Price may fluctuate in the range of 0.003–0.02.
- Risk Factor: Whether Web3 gaming and DeFi can truly gain traction on the IOST chain will determine if a second leg up occurs.
VI. IOST 2028 Price Prediction: Survival Logic in a Bear Market
- Historical Drawdowns: In the bear markets of 2018 and 2022, IOST saw maximum drawdowns of 70% and 65%, respectively.
- Support Factors: Staking yields, ecosystem lock-ups, and institutional holdings can provide price floor support.
- Scenario Prediction: The 0.001–0.006 range serves as a bear market bottom reference.
VII. IOST 2029–2030 Price Prediction: The Imagination Space of the Next Cycle
- 2029: The accumulation period before the BTC halving; historically, IOST’s pre‑halving expected rally has been modest.
- 2030: If the IOST ecosystem is active and daily active users reach the million level, the price ceiling could reach 0.05–0.1.
- Long-Term Case Reference: Long‑term holding logic for similar public chains can be drawn from ARB, ONDO , ICP, APT, etc.
VIII. Practical Guide for Crypto Newcomers
- Strategy Choices: Dollar‑cost averaging (DCA) suits stable ecosystem periods; swing trading suits phases with obvious volume fluctuations; long‑term holding suits the 2030 outlook.
- Trading Risks: When trading IOST on small and medium exchanges, watch for slippage, withdrawal processes, and security verification.
- Position Management: It is recommended that IOST not exceed 5–10% of your portfolio to prevent over‑concentration.
- Self‑Disciplined Stop‑Loss/Take‑Profit: Set price ranges based on your own risk tolerance rather than fully relying on others’ predictions.
IX. Conclusion: Is IOST Worth Investing In?
- Investment Logic: IOST’s value lies in technological innovation and ecosystem potential, not short‑term speculation.
- Biggest Risks: Slow ecosystem delivery and insufficient on‑chain activity.
- Advice for Newcomers: Start with a small position in 2026, monitor ecosystem and on‑chain activity, then adjust strategies based on market dynamics.
FAQ
Q1: Does IOST still have value now?
A1: IOST’s value mainly lies in its unique PoB consensus mechanism and scenarios like micropayments and gaming DApps. If on‑chain activity and ecosystem delivery continue to grow, long‑term holding still has potential.
Q2: When is the best time to buy IOST?
A2: Referring to the 2026–2028 price range predictions, 0.004–0.008 is a relatively safe entry point. Long‑term focus on on‑chain data and exchange liquidity is key.
Q3: What advantages does IOST have over TRX and EOS?
A3: IOST’s PoB mechanism balances efficiency and decentralization, making it suitable for high‑frequency trading scenarios. Although its ecosystem is smaller, it is still growing steadily.
Q4: How to trade IOST safely on HiBT?
A4: Ensure account security verification is complete, pay attention to slippage and withdrawal fees, and set reasonable stop‑loss and take‑profit levels.
Q5: Is IOST suitable for short‑term speculation?
A5: Excessive short‑term speculation is not recommended. Combine BTC trends and on‑chain activity for judgment. Long‑term holding, DCA, or participating in ecosystem applications may be more prudent.
Reminder
- Investment involves risk: The price predictions provided in this article are for reference only and do not guarantee returns. Investors must assess risks on their own.
- Diversify your investments: It is recommended that IOST account for no more than 5–10% of your crypto portfolio to avoid concentration risk in a single asset.
- Focus on ecosystem delivery: On‑chain activity, number of DApps, and exchange liquidity are important indicators for assessing IOST price support.
- Information sources: Data comes from public on‑chain information, HiBT exchange, and historical market data. Any third‑party predictions are for reference only.
- Long‑term perspective: IOST is suitable for medium‑ to long‑term positioning. Short‑term volatility is high, so maintain a rational mindset.